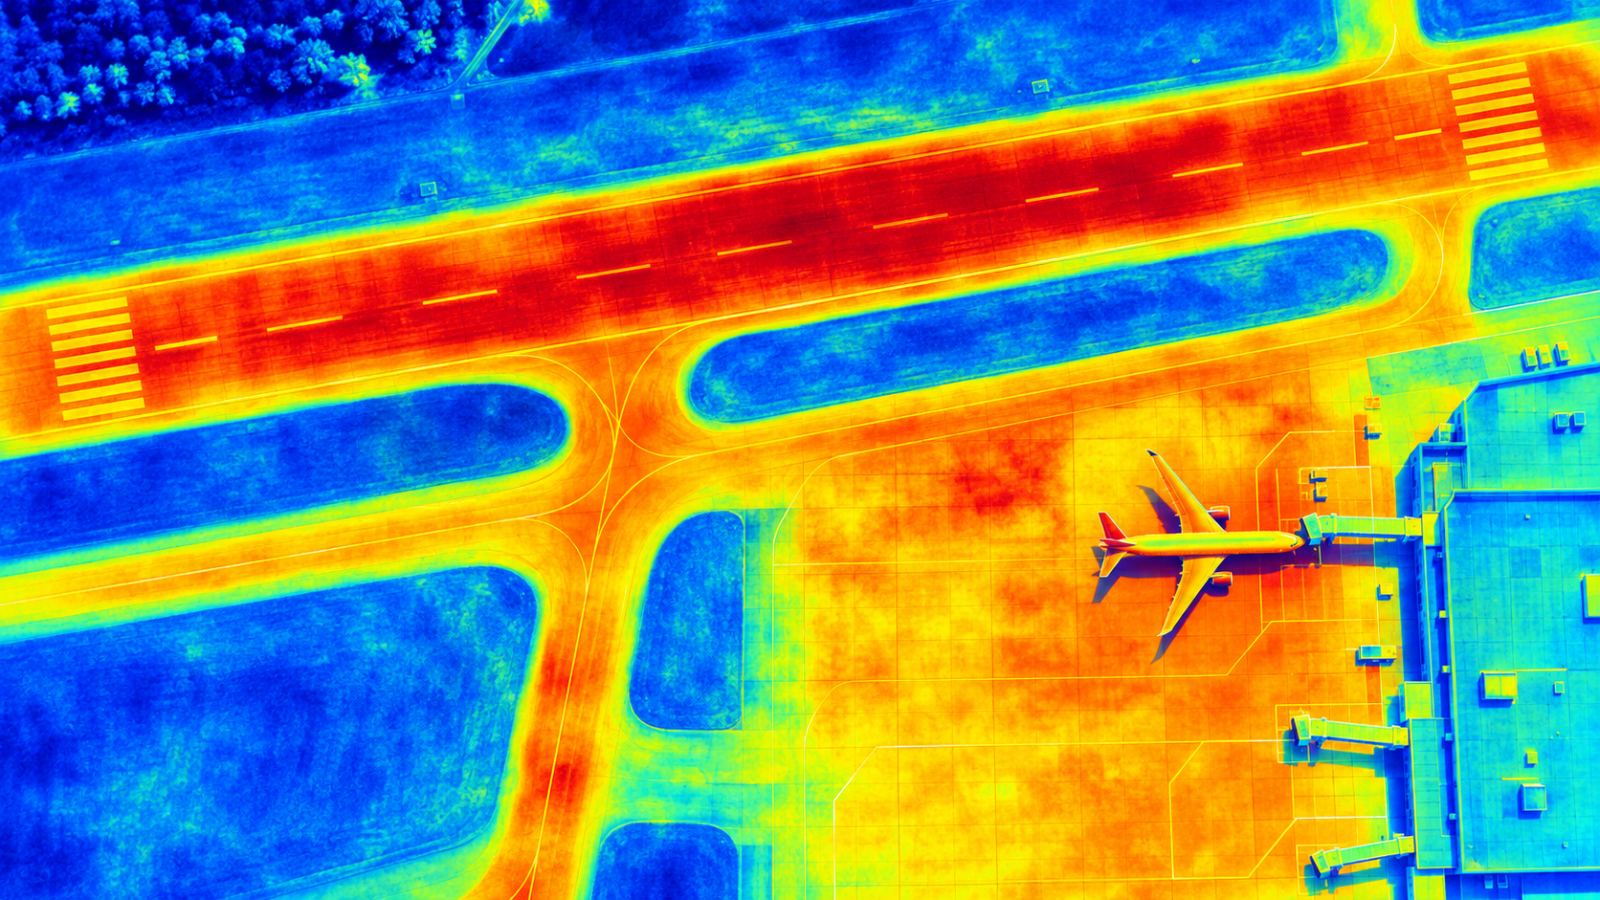
Runway and apron surface temperature.
See surface temperature across runways and aprons on the same map as ground movement.
What you see
Heat and cold, mapped across paved areas.
TOWER screens land surface temperature with Sentinel-3 thermal infrared data in cells of about 1 km and highlights thermal anomalies around runways and aprons. Temperature adds context to ground movement results.
- Surface temperature on runways and aprons
- Same grid and map as ground movement
- Useful context for freeze–thaw and hot-weather pavement checks
FAQ
Frequently asked questions
How is surface temperature measured?
From Sentinel-3 thermal infrared data, in cells of about 1 km. TOWER shows it on the same airport map as ground movement. It is a screening layer, not a pavement sensor.
Why combine temperature with ground movement?
Temperature changes affect pavements and soils. Seeing both together helps teams read movement results and plan checks, especially in winter.
Related pages
Work with us
Let’s run a PoC together.
We hope to start with public satellite data at your airport: no equipment, a screening report first, then field checks with your team.